The 207 Points
That Never Traded
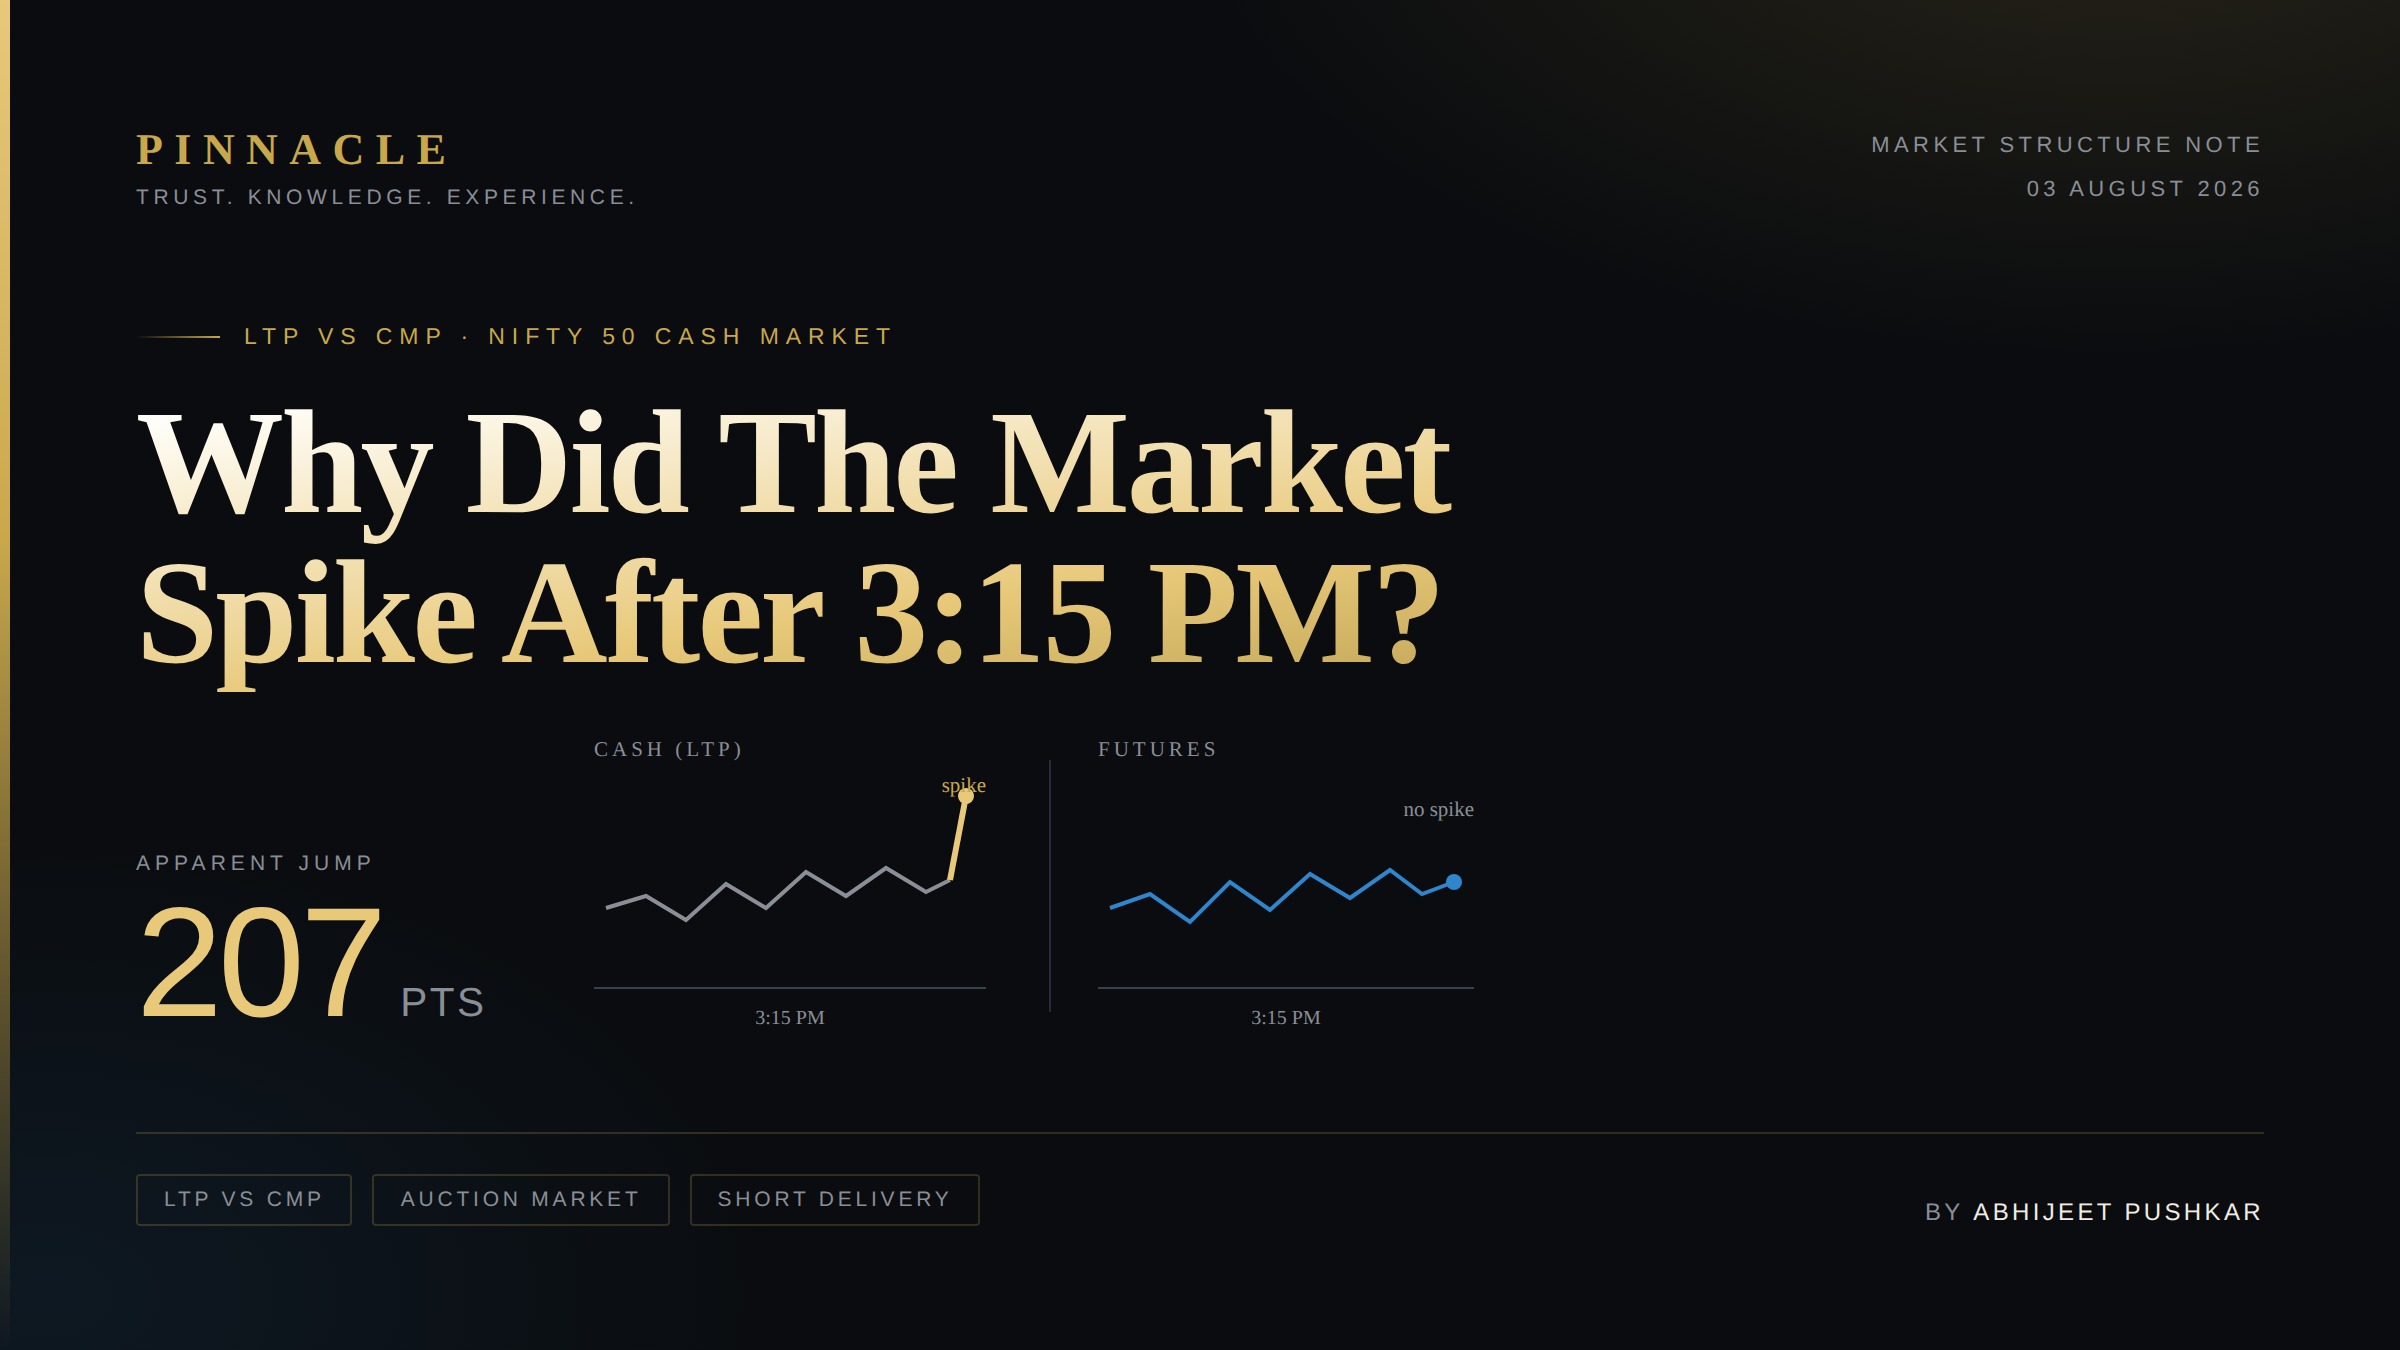
The cash market shut at 3:15 with Nifty at 24,570. Minutes later the index showed 24,777 — and the futures market did not move an inch. Nothing rallied. Here is the mechanism behind the print, step by step.
Between the last price the cash market actually traded at and the level printed after 3:15 — created entirely by post-session auction trades.
01Two different prices, both called “the price”
The whole event rests on a distinction most screens never make explicit: the price a market closed at and the price that was last traded are not always the same number.
The last traded price before the market closes, calculated from regular trading on the exchange. This is the number that represents the session.
The last traded price of any transaction — including auction trades, block deals and odd-lot transactions. It does not care when or how the trade happened.
02The cash market now stops at 3:15
Under the revised timings, regular trading in the cash segment ends at 3:15 PM. What follows is not a continuation of the session — it is a separate settlement window in which a narrow, specific set of trades can still print.
03What actually happened, in sequence
The chain begins with something entirely unglamorous — brokers’ risk plumbing — and ends with a headline index level. Each link is ordinary on its own. Together they produced a 207-point print.
Many brokers did not have the auto square-off mechanism in place for cash positions on the day. Intraday cash positions that should have been closed out were left open.
An open sell position with no shares to deliver becomes a short delivery. Those obligations do not disappear — the exchange has to source the shares from somewhere.
After 3:15, most of the short deliveries went into the auction market, where the missing shares are bought on the defaulting party’s behalf.
Auction buying is not price-sensitive — the shares must be obtained. Brokers purchased at prices well above the levels those same stocks had traded at minutes earlier.
Each auction fill became the last traded price for its stock. Because the index reads the LTP, those higher auction prices flowed straight into the Nifty calculation.
Nifty’s cash level was rebuilt off auction prints rather than traded prices — and displayed a level no one could have bought or sold at.
Not one of those 207 points came from anybody taking a view on the market. Every rupee of the move came from settlement obligations being met at whatever price was necessary.
04The futures market gives it away
If the market had genuinely repriced 207 points higher in the final minutes, futures would have moved with it — they always do. Futures did not move at all.
The reason is structural rather than sentimental: there is no auction mechanism in the futures segment. No short deliveries, no auction fills, nothing to distort the last traded price. Futures simply stayed where the market had left them.
05Why this counts as a glitch
“Glitch” is a precise word here, not a dismissive one. The index did exactly what it was designed to do — read the last traded prices and compute a level. The fault lies upstream, in auction fills being allowed to define the closing picture of a market that had already stopped trading.
- The inputs were valid, the output was misleading. Every auction trade was a genuine transaction. None of them represented market opinion at 3:15.
- The trigger was avoidable. Had auto square-off been in place across brokers, the short deliveries would never have reached the auction market in this volume.
- Anyone who has faced a short delivery will recognise it instantly. The pattern — an auction fill printing far away from the traded range — is familiar at the single-stock level. 3 August was the same thing, scaled up until it moved the index.
- It is expected to correct. A distortion of this kind does not persist. The level should be back in line the following morning, once regular trading resumes and real prices take over.
06What it means for anyone trading the close
The distinction matters well beyond a single session, because it changes what a chart is actually showing.
- The 3:15 candle is not always the close. A chart read at the end of regular trading showed 24,570. The level displayed afterwards was 24,777. Comparing a chart level against a reported figure can mean comparing two different things.
- Cash and futures can disagree, legitimately. When they disagree by this much, the question is which segment has a mechanism the other lacks — not which one is “right”.
- An unexplained spike deserves a mechanical explanation first. Volume, segment behaviour and timing usually identify an artefact faster than any narrative about buyers.
- The distorted level is a poor reference point. Carried forward, it makes the next session’s opening gap look dramatic when nothing has actually happened.
On days when a large gap opens between the traded price and the displayed price, both numbers are correct — they answer different questions. Knowing which one a position actually settles against is the difference between an outcome that looks unexplained and one that makes complete sense.
07The short version
08The full data — every stock, before and after
This is the evidence behind everything above. For each of the largest Nifty stocks: the price at 3:15 when regular trading stopped, the price the auction printed afterwards, and the difference between the two. Highlighted rows landed within a hair of +0.95% of each other.
| Stock | Weight % | 3:15 close | Auction close (LTP) | Diff ₹ | Auction % | Nifty pts |
|---|---|---|---|---|---|---|
| HDFCBANK | 10.75 | 751.20 | 753.00 | +1.80 | +0.240% | +6.33 |
| RELIANCE | 8.23 | 1,309.00 | 1,319.00 | +10.00 | +0.764% | +15.45 |
| ICICIBANK ★ | 8.18 | 1,446.30 | 1,460.00 | +13.70 | +0.947% | +19.05 |
| BHARTIARTL ★ | 5.36 | 1,952.00 | 1,970.50 | +18.50 | +0.948% | +12.49 |
| LT | 4.23 | 3,998.30 | 4,025.00 | +26.70 | +0.668% | +6.94 |
| INFY | 3.87 | 1,170.20 | 1,180.00 | +9.80 | +0.837% | +7.97 |
| SBIN | 3.61 | 1,034.70 | 1,045.00 | +10.30 | +0.995% | +8.83 |
| AXISBANK | 3.28 | 1,253.00 | 1,272.00 | +19.00 | +1.516% | +12.23 |
| KOTAKBANK | 2.59 | 392.10 | 397.50 | +5.40 | +1.377% | +8.77 |
| M&M ★ | 2.54 | 3,396.30 | 3,428.60 | +32.30 | +0.951% | +5.94 |
| BAJFINANCE | 2.27 | 1,142.00 | 1,153.00 | +11.00 | +0.963% | +5.37 |
| TCS | 2.19 | 2,451.20 | 2,473.70 | +22.50 | +0.918% | +4.94 |
| SUNPHARMA ★ | 1.88 | 1,945.00 | 1,963.50 | +18.50 | +0.951% | +4.40 |
| HINDUNILVR | 1.82 | 2,119.90 | 2,138.00 | +18.10 | +0.854% | +3.82 |
| NTPC ★ | 1.70 | 347.60 | 350.90 | +3.30 | +0.949% | +3.97 |
| TITAN | 1.56 | 4,902.50 | 5,000.00 | +97.50 | +1.989% | +7.63 |
| MARUTI | 1.56 | 14,100.00 | 14,150.00 | +50.00 | +0.355% | +1.36 |
| BAJAJFINSV | 0.90 | 2,082.90 | 2,096.00 | +13.10 | +0.629% | +1.39 |
| ITC | 2.75 | — | 287.00 | — | — | — |
| 18 stocks measured | 66.52 | +0.837% | +136.87 |
★ marks the five stocks that landed within 0.004 percentage points of each other. ITC has an auction price but no captured 3:15 price, so it is excluded from the measured block. “Nifty pts” is each stock’s contribution to the index, which depends on its weight as much as its move — Titan gained 1.99% and delivered 7.63 points, while ICICI gained half as much and delivered 19.05.
The math ties out exactly
This is the proof it was mechanical rather than a genuine move. Take every stock’s auction move, weight it by its share of the index, and add it all up. It has to equal the index gap — and it does, to the last point.
| Group | Index weight | Avg auction move | Nifty pts |
|---|---|---|---|
| The 18 stocks measured | 66.5% | +0.84% | +137 |
| Remaining 31 constituents | 33.5% | +0.69% | +57 |
| Total | 100% | +0.79% | +194 |
The 18 measured stocks are 66.5% of the index and account for roughly 70% of the jump. The remaining 31 constituents are derived by difference — it is what they must have contributed for the total to hold, rather than an independent measurement.
What the table shows at a glance
- Almost everything jumped together. Eighteen unrelated companies — banks, telecom, power, pharma, autos, IT — all printed higher in the auction at the same moment. Nothing in the news explains that. Forced auction buying does.
- The big weights did the damage. ICICI Bank, Reliance, Bharti Airtel, Axis Bank, SBI and Kotak between them account for most of the index gain, simply because they carry the most weight. Weight matters more than the size of the move: Titan gained 1.99% and added 7.63 points, while ICICI gained half as much and added 19.05.
- Thin books moved furthest. Titan (+1.99%), Axis (+1.52%) and Kotak (+1.38%) rose most because there were fewer sellers waiting in the auction. HDFC Bank (+0.24%) and Maruti (+0.36%) barely moved because there were plenty.
- Five landed on almost the same number. ICICI, Airtel, NTPC, M&M and Sun Pharma all printed within 0.004 percentage points of +0.95% — five different sectors, one figure.
The index figures quoted through this piece — around 24,570 before and 24,777 after — are the round levels most people saw on their screens. The stock-level contributions in the table are calculated from the precise index levels of 24,580.00 and 24,774.30, a gap of 194.30 points. The small difference is rounding, and it does not change anything in the explanation.
09Method & caveats
Levels. 24,570 is the Nifty 50 cash level from regular trading at 3:15 PM; 24,777 is the level displayed once auction trades had printed. The precise levels behind the stock-level table are 24,580.00 and 24,774.30, a gap of 194.30 points.
What is established and what is inferred. The divergence between the cash and futures segments is directly observable, and the absence of an auction mechanism in futures is a matter of market structure. The attribution to short deliveries arising from absent auto square-off reflects broker behaviour observed on the day; it is not drawn from exchange auction order-book data.
Sources. 3:15 prices read from 1-hour charts (NSE); auction closes from the index movers list. Weights are free-float index weights as published for the period; index weights drift over time, which shifts the measured/inferred split slightly but not the total.
On the word “glitch”. No exchange system failed. The term describes an index level that was arithmetically correct but did not represent any tradeable market price.
Join the discussion
Questions, counterpoints and alternative readings of the auction print are all welcome. Every comment is reviewed by Abhijeet before it appears on the page.